Routine Results
| PFS Weekly Results – Orbit 399 | |
 |
|
| Air temperatures vs. altitude | Hi-res: 0.07 MB |
 |
|
| Integrated dust optical thickness | Hi-res: 0.06 MB |
 |
|
| Surface Temperature | |
Orbit 399 Default Plots
01 May 2006 – Orbit: 399
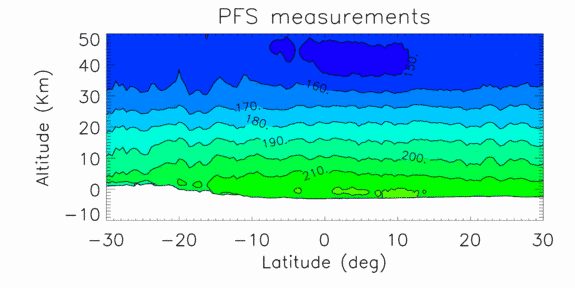
The first plot presents, in colour code, the air temperatures vs. altitude along an orbital track of PFS. Black solid curves connect points with the same temperatures. Labels give the actual values, in kelvins. PFS sensitivity is particularly high in the altutide range 5-45 km. Altitudes are taken from MOLA data.
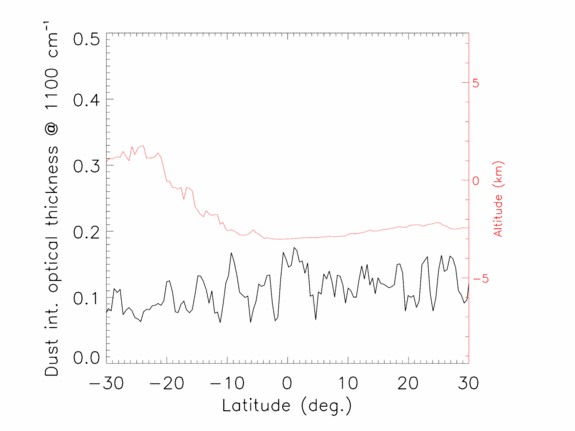
The second plot provides the value of the integrated dust optical thickness measured at 1100 cm-1. This quantity is proportional to the total content of silicate aerosol in the Martian atmosphere above the observed region. The altimetry of surface (in metres) is also given for comparison.
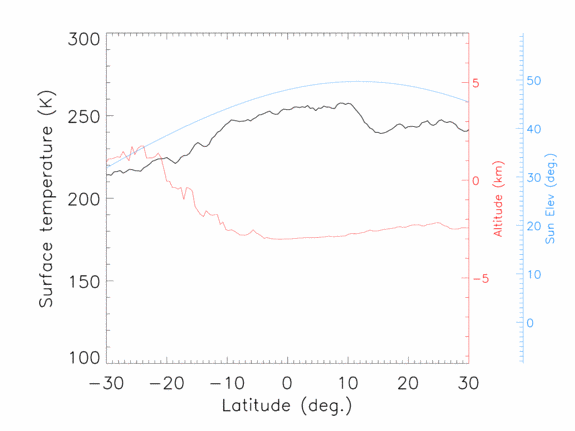
The third plot provides the value of the surface temperature, as estimated from the planet’s IR emission in the spectral range covered by PFS LWC. The altimetry of surface (in metres) is also given for comparison, as well as the Sun’s altitude above the horizon.
credits: ESA/ASI/INAF (Formisano)
Google+