Hot Topic
PFS on Mars Express makes non-LTE observations
 |
|
|
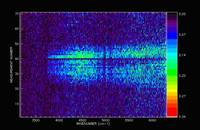
Figure 1 – Orbit 1234 . Spectrogram of the measurements of the SW channel between 2100 and 2950 cm-1. The colour code is automatically chosen to span all colours over the available radiance variation and is given on the right in ergs/(s sr cm2 cm-1) . |
The Planetary Fourier Spectrometer (PFS) on board Mars Express has made limb observations of the non-Local Thermodynamic Equilibrium (LTE) emission by CO and CO2 isotopic molecules in the upper atmosphere of Mars, the results of which may mean that presently available non-LTE models need to be modified.
1060 cm-1 ‘hot bands’ and the radiance emitted was in excess of the thermal energy available. These observations led to the development of a number of non-LTE models to explain this phenomenon.
An extensive study of the same hot-band emission (9.4 and 10.4 microns) by Mars Global Surveyor found that non-LTE emission from these hot bands was observed over a range of 120 degrees in latitude. This emission was observed between the altitudes of 50 and 90 km with the tendency to decrease at lower heights toward the sub-solar point, where also the maximum of the emission was observed.
 |
|
|
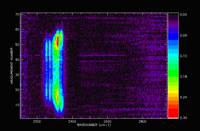
Figure 2 – Orbit 1234 . Spectrogram of the measurements of the SW channel between 3150 and 6300 cm-1. The colour code is automatically chosen to span all colours over the available radiance variation and is given on the right in ergs/(s sr cm2 cm-1). |
Non-LTE emission at 4.3 microns had been observed first with ESA’s ISO spacecraft and more recently with nadir-viewing observations with the PFS on Mars Express. ISO was observing the infrared spectrum of Mars from Earth, and found evidence of the non-LTE emission inside the 4.3-micron CO2 absorption band. PFS’s nadir observations found a clear double band in emission due to non-LTE effects in the upper atmosphere.
It is now thought that most of the peak emission (around 2320 – 2340 cm-1) was coming from an altitude region between 100 and 140 km, while outside the strongest lines of the R- and P- branches (at 2300 or 2350 cm-1) the layers contributing the most were in the mesosphere, between 80 and 120 km.
 |
|
|
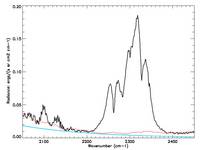
Figure 3 – Average spectrum over the entire set of measurements. Note the presence of the CO emission at 2100 cm-1. The red line is the deep space signal, while the blue curve is a Planckian at 190 K. |
Some limb measurements of the OMEGA experiment on Mars Express recently found CO emission with a peak emission at 50 km, while CO2 emission was observed mostly above that height.
In this study, PFS looked at two orbits, exploring latitudes from 75 to 15 degrees. Due to the orbit and the attitude of the spacecraft, these PFS observations were tangent to the planet and never intersected with the surface or even altitudes below 80 km. Emission from CO and CO2 was observed, with the CO emission peaking at altitudes lower than the CO2 emission peak.
 |
|
|
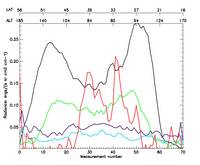
Figure 4 – Radiance profile along the observation path. Black 626 isotope peak, green the 636 isotope peak, light and dark blue the CO peaks at 2100 and 2130 cm-1, red scattered radiation at 4200 cm-1. Latitude ( degrees) and Altitude ( Km) of each measurement is given on top the figure. |
In general, in the season observed (northern summer), the emission intensity increased with lower latitudes. The peak emission height also decreased with decreasing latitude. By comparison with Hitran database, the emitted bands were identified as the second hot band for the 626 and 636 molecule, while for the 628 and 627 the band emitted was possibly the third hot band. Other minor bands or lines are also observed in the emission.
The most important aspect of the CO2 emission is the intensity of the emission from isotopic molecules like 636 and 628. The CO2 isotopic molecules were found to be emitting radiance out of proportion with respect to the normal isotopic abundance: the measured intensity of the 636 and 628 isotopes were comparable (within a factor roughly 2) with the emission of the molecule 626, while their isotopic abundance was of the order of 1/90 and 1/250 respectively.
 |
|
|
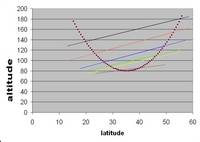
Figure 5 – Altitude – latitude profile of the optical axis of PFS, for the 71 measurements. The colour lines connect the 2 measurements with the max 626 emission (blue line), 636 emission (green line), CO emission (yellow line), and scattered radiation (brown line). See text. |
The intensity of the radiation emitted by these molecules should be, therefore, much below the intensity of the radiation emitted by the main isotope 626 if only direct solar excitation would be working.
The observed ratio for the isotope 636 is of the order of 2, so either this isotope is much more abundant at this altitude (which sounds very unlikely) or there is a strong pumping of energy from normal 626 to 636 by means of collisions, so that excitation is transferred from normal isotopic molecule 626 to the isotopic 636 one.
The same is also occurring for the 628 isotopic molecule, which in the second case studied (orbit 1413) appears to be emitting more than the 636 molecules, although their isotopic ratio would indicate an emission 2.8 times lower. In this case, however, modelling is needed to be able to estimate the radiance intensity, as its band adds to that of the 626 isotopic molecule.
 |
|
|
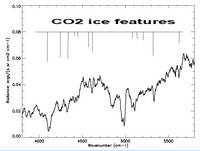
Figure 6 – PFS average spectrum over all the measurements showing scattered radiation. |
For more information:
Prof. Vittorio Formisano
Istituto di Fisica dello Spazio Interplanetario INAF-IFSI,
Via del Fosso del Cavaliere 100, 00133 Roma, ITALY
Phone: +39 064 993 4362 | Fax: +39 064 993 4074
E-mail address: Vittorio.Formisano @ ifsi.rm.cnr.it
The full paper was written by V. Formisano, A. Maturilli, M. Giuranna, E. D’Aversa and M.A. Lopez-Valverde.