Showing PFS results
What does a PFS spectrum tell us?
The saying goes that a picture is worth a thousand words. However when it comes to exploring Mars, the steady supply of infrared spectra from the Planetary Fourier Spectrometer (PFS) instrument is more valuable to science than the most spectacular single image of the Red Planet.
It is true that by comparison to the widely varied Martian panoramas returned by orbiting cameras, the wavering line of a PFS spectrum hardly catches the eye. Yet that line encapsulates a mass of data about all aspects of the Martian environment.
|
"PFS combines a high spectral resolution with an extremely wide spectral range. It is going to take a lot of work and a lot of time to study it all. We are just getting started." sais Vittorio Formisano |
"A PFS spectrum is not like visible imaging," said Vittorio Formisano, Principal Investigator of the PFS instrument. "You may have a beautiful image of the surface or the edge of the atmosphere, and you may discover a few features here or there, but you are seriously restricted. You cannot say anything about the composition of what you are observing.
"By contrast PFS combines a high spectral resolution with an extremely wide spectral range, so we receive a huge amount of information within its global spectrum. It is going to take a lot of work and a lot of time to study it all. We are just getting started."
|
|
|
PFS integrated on Mars Express |
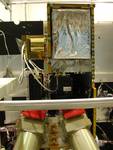
From PFS spectra we can learn what Martian soil is made of and the weather patterns on the surface; the distribution of trace gases and vertical temperature and pressure profiles across its thin atmosphere; the composition of its icy poles and the distribution of water ice across the planet; along with the precise size and mineralogical properties of the particles forming its dust clouds and storms.
The spectra even provide a chance to indirectly look back in time: varied isotopes in the mix of molecules that make up its air can be detected, which potentially give us a glimpse into the distant prehistory of Mars as imbalances are found.
What are we looking at when we see a PFS spectrum? The overall spectrum covers invisible infrared range of wavelengths from about 1.2 microns across up to 45 microns (represented in wavenumber from 250 to 8200 cm-1). The left hand part comes from a channel covering the long wave ‘far infrared’ thermal region – the heat energy emitted from Mars. The other channel measures the reminder of the spectrum, representing short wave ‘near infrared’ wavelengths of solar light reflected from the Red Planet.
The infrared region is useful scientifically because it corresponds to radiation levels that can ‘excite’ molecules to vibrate at a certain number of higher energy states, as determined by the molecule’s properties. Excited molecules then swiftly return to their ground state, their vibrational energy transformed into heat.
The result is spectral absorption features in emitted or reflected infrared light that are as distinctive as fingerprints. These are used to measure the presence and concentration of carbon dioxide, carbon monoxide, water and a host of other substances. Across the infrared range of wavelengths each type of molecule may have many separate spectral absorption features depending on its energy state – carbon dioxide alone has many hundreds.
The PFS spectrum plots radiance not against wavelength but the more convenient to work with value of wavenumber. This is the number of waves per unit length, the spatial equivalent of frequency and the inverse of wavelength, usually given in inverse centimetres or cm-1. So 10000 cm-1 is 1 micron (millionths of a metre), 20000 cm-1 is 0.5 microns and on to larger wavenumbers, while 2000 cm-1 is 5 microns and 1000 cm-1 is 10 microns and so on to smaller wavenumbers.
|
"However we are working on the edge of all previous knowledge: the PFS spectrum shows hundreds of unknown small lines that will take a long time to identify," explained Formisano. |
How do the PFS team know what a given spectral absorption feature represents? To begin with make use of many decades of spectroscopic research, collected in the US-run HITRAN High resolution transmission molecular absorption database, which contains more than 1.7 million separate spectral lines.
And with the density, temperature and main components of the Martian atmosphere well known from previous space and Earth-based observations, for the last five years the PFS team have been modelling the Martian atmosphere to create detailed ‘synthetic spectra’ for comparison compared against the genuine article.
"However we are working on the edge of all previous knowledge: the PFS spectrum shows hundreds of unknown small lines that will take a long time to identify," explained Formisano. "HITRAN and other sources lack the information we need. It has nothing on methanol for example, so if we want to search for methanol in the Martian atmosphere I have to check with experts at our supporting laboratories to learn its absorption coefficient.
"They also carry out laboratory measurements with analogue materials to build up a database of the spectral properties of Martian minerals, soil and dust."
Armed with this information, the team can compare and contrast the actual results from Mars, progressing along the PFS spectrum to explore different segments of the Red Planet.
 |
|
|
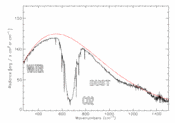
LWSpectrum – zoom 1 |
3Making our way through a typical spectrum, we begin in the long wave thermal region. It is here that a number of water lines give information on the amount of water vapour in the middle of the atmosphere. It also shows the largest single band of carbon dioxide: this steeply descending band is significant because it is from these results that vertical temperature and pressure profiles are derived for the Martian atmosphere.
The PFS spectrum is shown with the synthetic spectrum for the observed Martian surface temperature of 275.5 Kelvin (2.5 Celsius) and against a spectrum observed by ESA’s Infrared Space Observatory (ISO) spacecraft.
Beyond it comes the wide dust band, from which can be gathered the spectral properties of atmospheric dust, or – if the sky is clear – the surface of Mars.
Further still is an opportunity to study the isotopic composition of the atmosphere, with vertical thin lines that are different depending on the isotope of the molecule. Different isotopes have different mass, so for example a preponderance of lighter isotopes may show how much of the thin Martian atmosphere has been historically lost to space.
 |
|
|
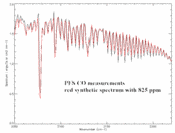
CO lines – zoom 2 |
Now in the short wave channel region, though still with some thermal radiation from Mars, this zoom shows the multiple lines of carbon monoxide typical of this molecule.
Carbon monoxide is more common on Mars than on Earth: the spectral line here represented against a synthetic spectrum based on an abundance of 825 parts per million, as against a mere 0.1 parts per million on Earth.
 |
|
|
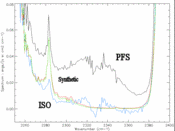
nonlte – zoom 3 |
This zoom is on another carbon dioxide around 4.3 microns that should be completely saturated, meaning that no radiation is detected by the instrument in this band. However in actuality a small amount of radiance is detected from carbon dioxide molecules up above 100 kilometres in altitude.
What is being detected is a complex phenomenon called non-local thermodynamical equilibrium (non-LTE), where molecules are excited by solar radiation on the same basis as carbon dioxide lasers, emitting high amounts of radiation. Observations of this intriguing subject represent another intriguing phenomenon in which PFS can contribute.
[Zoom missing]
This area shows lines for water vapour in the lowest part of the atmosphere, enabling the measurement of water content in correlation with data on ice in the permafrost and underground.
From here is the spectrum of the Sun shining through the Martian atmosphere, a useful source of study in its own right as the majority of absorption lines seen in the Sun’s corona – known as the solar spectrum – remain unknown to this day.
[Zoom missing]
Then there are many minor species or trace gases in this region of the spectrum, including ozone and PFS has sufficient spectral resolution to pick out a single line of methane from surrounding minor water lines.
"The presence of methane is significant because it shows evidence of non-stable equilibrium conditions on Mars," Formisano explained.
Some sort of active chemical process is necessary to replenish methane levels, broken down in the air by powerful ultraviolet light. Possible sources of this fresh methane include volcanism or some kind of biological chemical process.